
_and_nanoscale_secondary_ion_mass_spectrometry_(nano-si.tiff)
Introduction
Global tightening of carbon regulations and concerns over resource depletion have increased the demand for vehicle lightweighting for improved fuel efficiency, while simultaneously accelerating the adoption of ultra-high strength materials to ensure crash safety (Pouranvari and Marashi 2013). In response to these demands, hot-stamped high strength steels have been widely used for automotive structural components because they can achieve high strength more than 1500 MPa through rapid cooling after austenitization and forming. In addition, resistance spot welding (RSW) is widely applied to body assembly processes owing to its ease of lap joining and high productivity, and recent studies have continued to examine its weldability for automotive and industrial sheet joining (Y. M. Kim and Hwang 2025; Y. M. Kim et al. 2025; J. Kim and Kang 2025), and the high quality of welded joints is recognized as a key factor for their wide use.
In resistance spot-welded high-strength steels, strength under shear loading, the tensile shear strength has been reported to increase with increasing weld diameter, whereas the cross-tension strength (CTS) is reported to decrease. This is because the cross-tension test is dominated by opening-mode loading, and so the increased hardenability associated with greater alloying additions is believed to reduce plastic deformability and thereby lower the strength (Pouranvari and Marashi 2012; Oikawa et al. 2007). In other words, the reduction in CTS is more directly related not simply to the strength (hardness) level itself, but to resistance to crack initiation and propagation (fracture toughness) in the sheet interfacial region and areas adjacent to the fusion boundary (Nadimi and Pouranvari 2025).
Softening near the fusion boundary has been frequently observed in RSW of high-strength steel sheets, and it has been widely suggested that the softened region (halo ring) formed by decarburization during welding can act as a vulnerable path for crack propagation (Sherepenko et al. 2020, 2021; Mohamadizadeh et al. 2020; Jing et al. 2023; Ramachandran et al. 2022; Manladan et al. 2025; Ramachandran et al. 2023). More recently, it has been proposed that a partially melted zone (PMZ) forms when the region adjacent to the fusion boundary is exposed to the temperature where a two-phase region consisting of δ-ferrite + liquid exists, and that local segregation may occur in this region because of alloy partitioning and enrichment (Jing et al. 2022; Park et al. 2019; Taniguchi et al. 2024; Marshall et al. 2023). In particular, as the residence time of this region in the two-phase (δ + L) field increases with increased weld time, segregation may become more severe. In steels with high carbon content such behavior has been discussed as being possible even during a relatively short residence time (Taniguchi et al. 2024). Most reported previous studies have mainly focused on the mere “presence of softening” or the “characteristics of the final fracture surface,” but explanations based on the actual crack propagation process, namely how the microstructural and compositional changes influence the crack propagation sequence, remain relatively limited (Sherepenko et al. 2021; Mohamadizadeh et al. 2020; Ramachandran et al. 2022).
Therefore, the objective of this study is to identify the factors that influence brittle crack initiation and propagation by elucidating the low CTS and brittle fracture behavior observed in Al-Si-coated 1.8 GPa grade 30MnB5 hot-stamped steel RSW joints from the perspective of a stage-resolved crack propagation process. The goal is also to examine the link between the cracking mechanism and alloy segregation and local softening in the PMZ.
Experimental Procedure
Materials and Resistance Spot Welding
The material used in this study was 1.2-mm-thick (0.047-in.-thick) Al-Si-coated (coating thickness of 20 μm) 1.8 GPa grade hot-stamped steel with a nominal chemical composition of 0.3C-0.2Si-1.4Mn-0.008P-0.001S-0.002B (wt-%). The Ac1 and Ac3 temperatures were approximately 750°C and 810°C, respectively. Resistance spot welding was performed by overlapping two coupons cut from the base material sheets. These welded specimens were used for microstructural analysis of the joints. Welding was carried out using a medium-frequency direct current static RSW machine under an electrode force of 3.5 kN (787 lb force). The squeeze time and hold time were set to 300 ms and 83 ms, respectively, and a welding current of 7.0 kA was applied for 350 ms. Copper-Chromium dome-shaped ISO type F1 electrodes with a tip diameter of 8 mm (0.315 in.) were used. The electrode cooling-water flow rate was 4 L/min.
Cross Tension Test and Interrupted Test
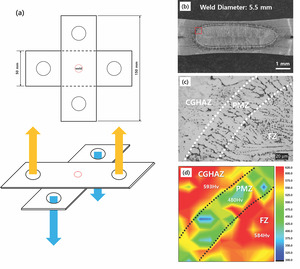
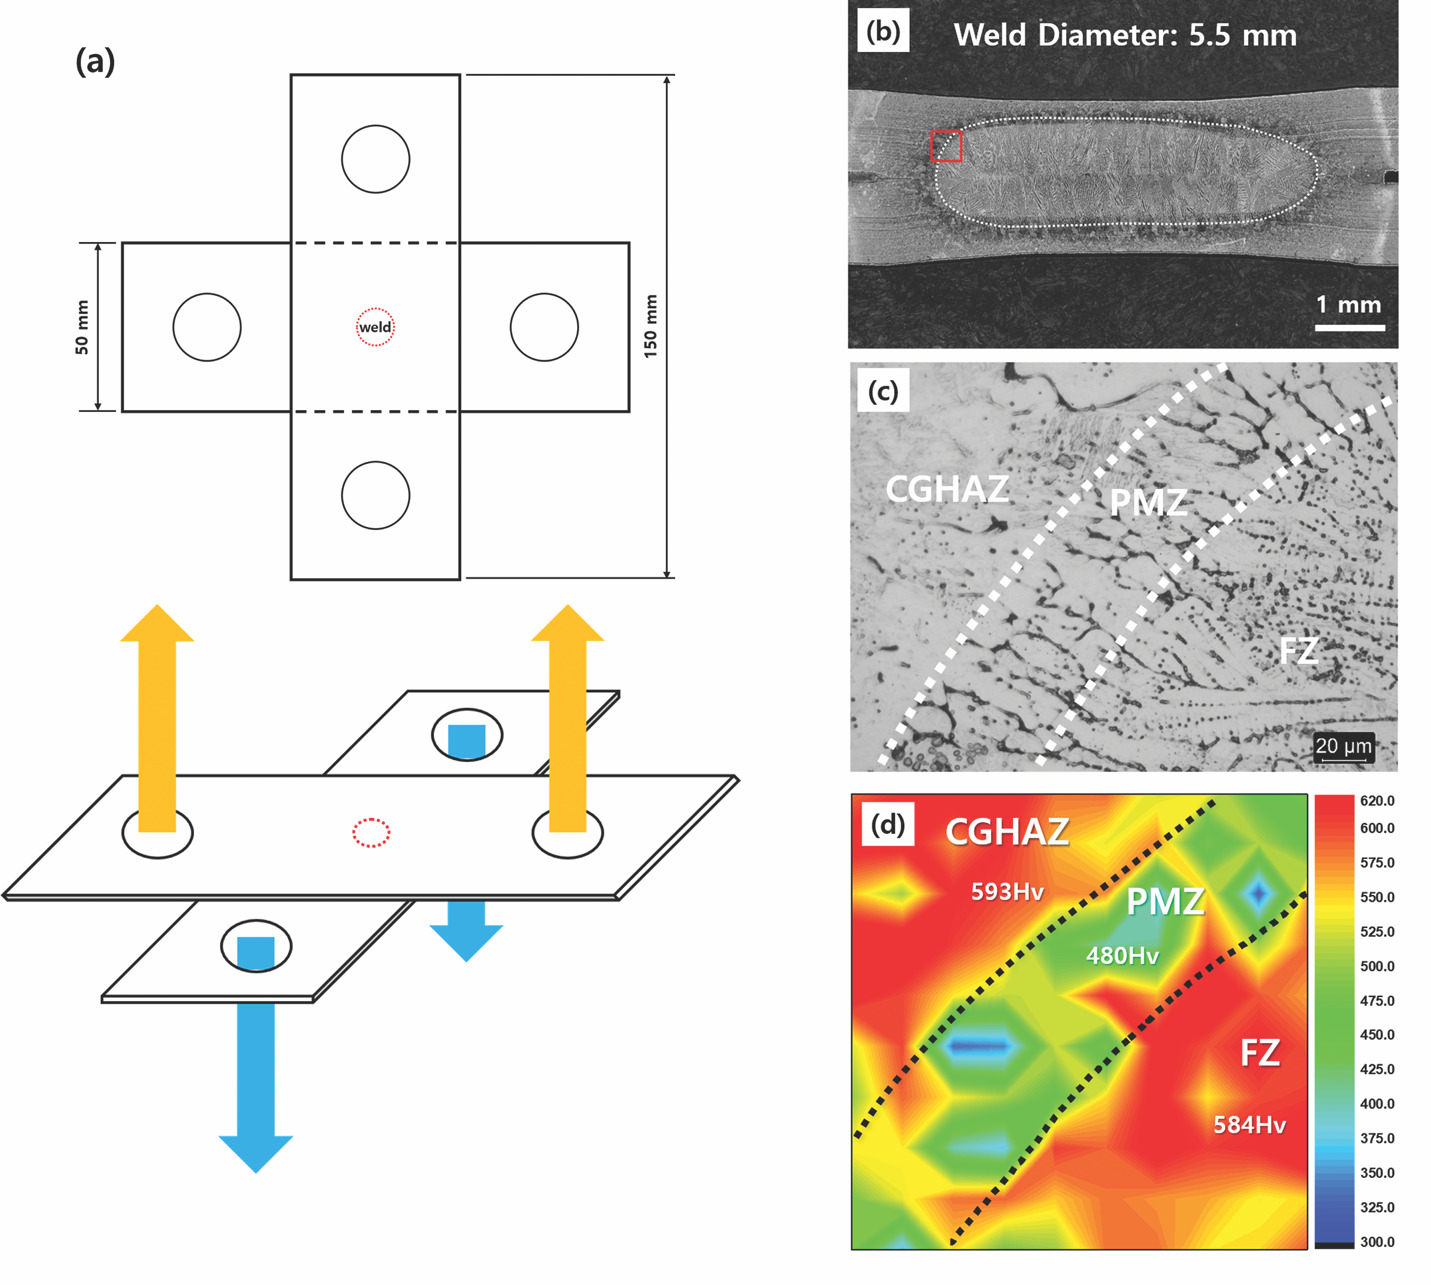
Cross-tension specimens were prepared by overlapping sheets in accordance with AWS D8.9 (American Welding Society 2012), and cross-tension tests were conducted at a crosshead speed of 10 mm/min (0.394 in./min). The configuration of the cross-tension specimen is schematically shown in Fig. 1A. Four replicate samples were prepared and tested. The fracture surfaces were examined in the notch region at the sheet-to-sheet interface, along the longitudinal direction of the upper sheet, where stress was expected to concentrate first during the cross-tension test, toward the thickness direction. For the interrupted test used to identify the crack propagation stage, a previous study (Krajcarz et al. 2013) reported a correlation between pop-in and crack initiation. A pop-in in a tensile test is a sudden, small discontinuity in the force-displacement curve, represented by a quick, vertical drop in force followed by an increase. It indicates a localized, unstable failure event such as a brittle crack initiation and arrest or abrupt dislocation motion within a material. Based on this correlation criteria, the tests were repeated on four samples using the pop-in point, at which an instantaneous load drop and displacement increase appeared on the load-displacement curve, which was used as the interruption criterion (Krajcarz et al. 2013). The crack propagation process was analyzed on sample cross-sectioned through the center of the joint, taken along the longitudinal direction of the upper sheet of the interrupted-test specimens.
Microstructural Analysis
For microstructural analysis, cross-sectional specimens from the welds were polished with colloidal silica to 0.04 μm. Vickers hardness mapping (Mitutoyo, HM-200) was performed under a 50 g load (dwell time: 10 s) at 30 μm distance intervals over a 300 μm × 300 μm area, with the fusion boundary positioned at the center of the mapped region. The weld solidification structure and prior austenite grain boundaries (PAGBs) were observed under optical microscopy after 10 min of picric acid etching at room temperature. In contrast, specimens for scanning electron microscope (SEM) observation were etched in 5% nital for 5 s at room temperature and observed at an accelerating voltage of 15 kV using a scanning electron microscope equipped with a field-emission gun (FE-SEM; JSM-IT800; DEU Converging Materials Core Facility, supported by the Korea Basic Science, NFEC-2021-12-275266). Elemental distributions in the fusion boundary region were analyzed by Electron Probe Micro Analyzer (EPMA) (JEOL, JXA-8530F) at an accelerating voltage of 15 kV, a dwell time of 20 ms, and an interval of 1 μm for carbon, manganese, and phosphorus. Although EPMA was used to examine the overall elemental distribution near the PMZ, nanoscale secondary ion mass spectrometry (Nano-SIMS) analysis was additionally performed to assess the segregation behavior of trace elements, particularly B and P, with higher sensitivity. Nano-SIMS analysis was conducted at the Busan Center of the Korea Basic Science Institute (KBSI) using a Nano-SIMS 50 instrument (CAMECA, France) equipped with a Cs+ primary ion source. Ion imaging was performed at an impact energy of 16.0 keV and a probe current of 1.0 pA over an analysis area of 40 μm × 40 μm. The role of the martensitic structure on crack propagation was analyzed by simultaneous electron backscatter diffraction (EBSD) and energy-dispersive x-ray spectroscopy (EDS) measurements, because the weld region of the 1.8 GPa steel was mainly composed of brittle martensite, and crack propagation can be affected by both its hierarchical crystallographic features and local chemical inhomogeneity. For this, a step size of 0.20 μm was used for general mapping. Specific regions of interest were analyzed at high magnification, using an 85 nm step size and 20 kV. The EBSD datasets were processed using OIM Analysis software. Grain CI standardization was applied with a tolerance angle of 5 deg and a minimum grain size of 2 data points, followed by Neighbor Orientation Correlation using a tolerance angle of 5 deg, a minimum confidence index of 0.1, and a cleanup level of 3. Depending on the dataset, approximately 6.3–8.9% of the measured data points were modified by the Neighbor Orientation Correlation procedure.
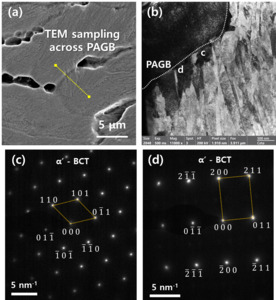
To examine the nanoscale microstructure and local phase constitution near the PAGB in the PMZ, material from the PMZ adjacent to the fusion boundary was sampled by Focused Ion Beam (FIB). FIB (Thermo Fisher Scientific, Scios2) was used to cut, mill, and manipulate materials for sample preparation. For Transmission Electron Microscopy (TEM), FIB is an excellent technique for preparing ultrathin sample foils from specific microscopic locations. The prepared specimen was analyzed using a TEM (Thermo Fisher Scientific, Talos F200X) at 200 kV.
Thermal Simulation
The temperature history during welding was analyzed using finite element simulation with SORPAS 2D® resistance spot welding software, under the same parameters and conditions as in the actual welding experiments. A custom material dataset based on the chemical composition and material property data provided by the steel manufacturer for this steel grade was used, and the Al-Si coating was explicitly modeled with a measured average thickness of 20 μm. The simulation was performed under coupled multiphysics conditions, incorporating electrical heating, heat transfer, and material behavior. The change in the contact area as welding progresses, the base material thickness, electrode geometry, electrode force, welding current, weld time, and hold time were set to match the experimental conditions (Nellikode et al. 2025). To understand the formation of the partially melted zone, temperature history data were extracted from meshes located immediately adjacent to the fusion boundary and compared, using JMatPro®, with the equilibrium phase formation temperatures of δ-ferrite, austenite, and liquid for 30MnB5 steel.
Results
Results Of Microstructural Observations, Cross Tension Test, and Vickers Hardness Distribution
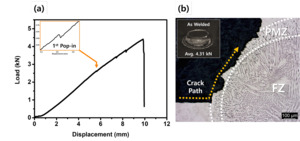
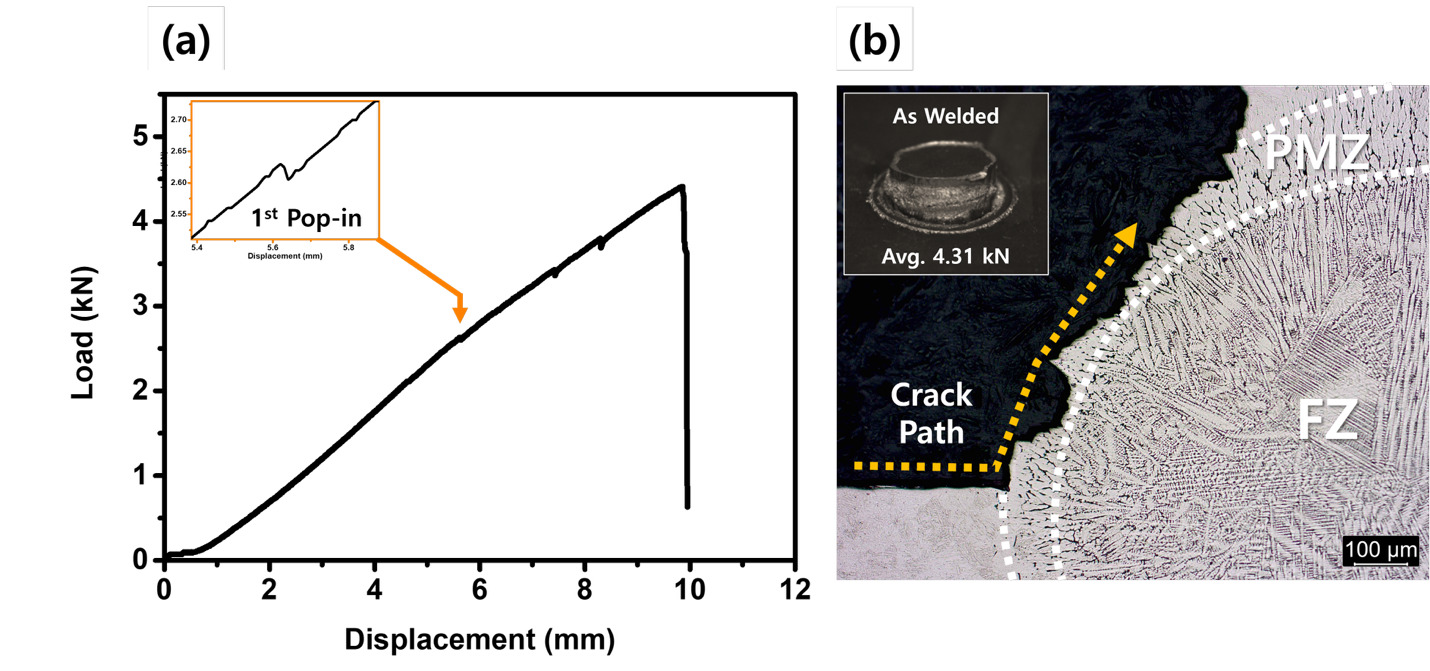
Under the welding condition used in this study, the weld diameter was measured to be 5.5 mm (0.217 in.) (Fig. 1B). Weld cross-sectional examination revealed a PMZ near the fusion boundary consisting of elongated grains with a width of approximately 60 μm (Fig. 1C). The peak load in the cross-tension test was 4.31 ± 0.19 kN (969 lb force) (n=4) (Fig. 2A). Cross-sectional observation of the fractured specimen along the notch region located in the longitudinal direction of the upper sheet showed that the crack did not propagate through the fusion zone (FZ); instead, it initiated at the notch at the sheet-to-sheet interface and propagated along the PMZ (Fig. 2B). The average Vickers’ hardness of the FZ and heat-affected zone (HAZ) were both about 590 HV. In contrast, the PMZ exhibited a relatively lower average hardness of 480 HV. The hardness mapping result is shown in Fig. 1D.
SEM Observations of Weld Area Microstructures and Fracture Surfaces
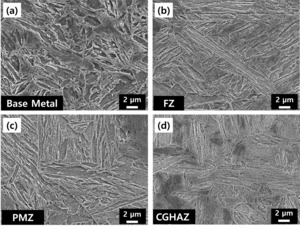
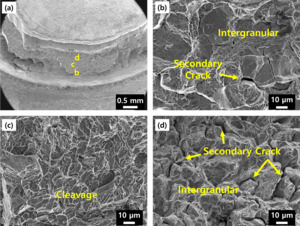
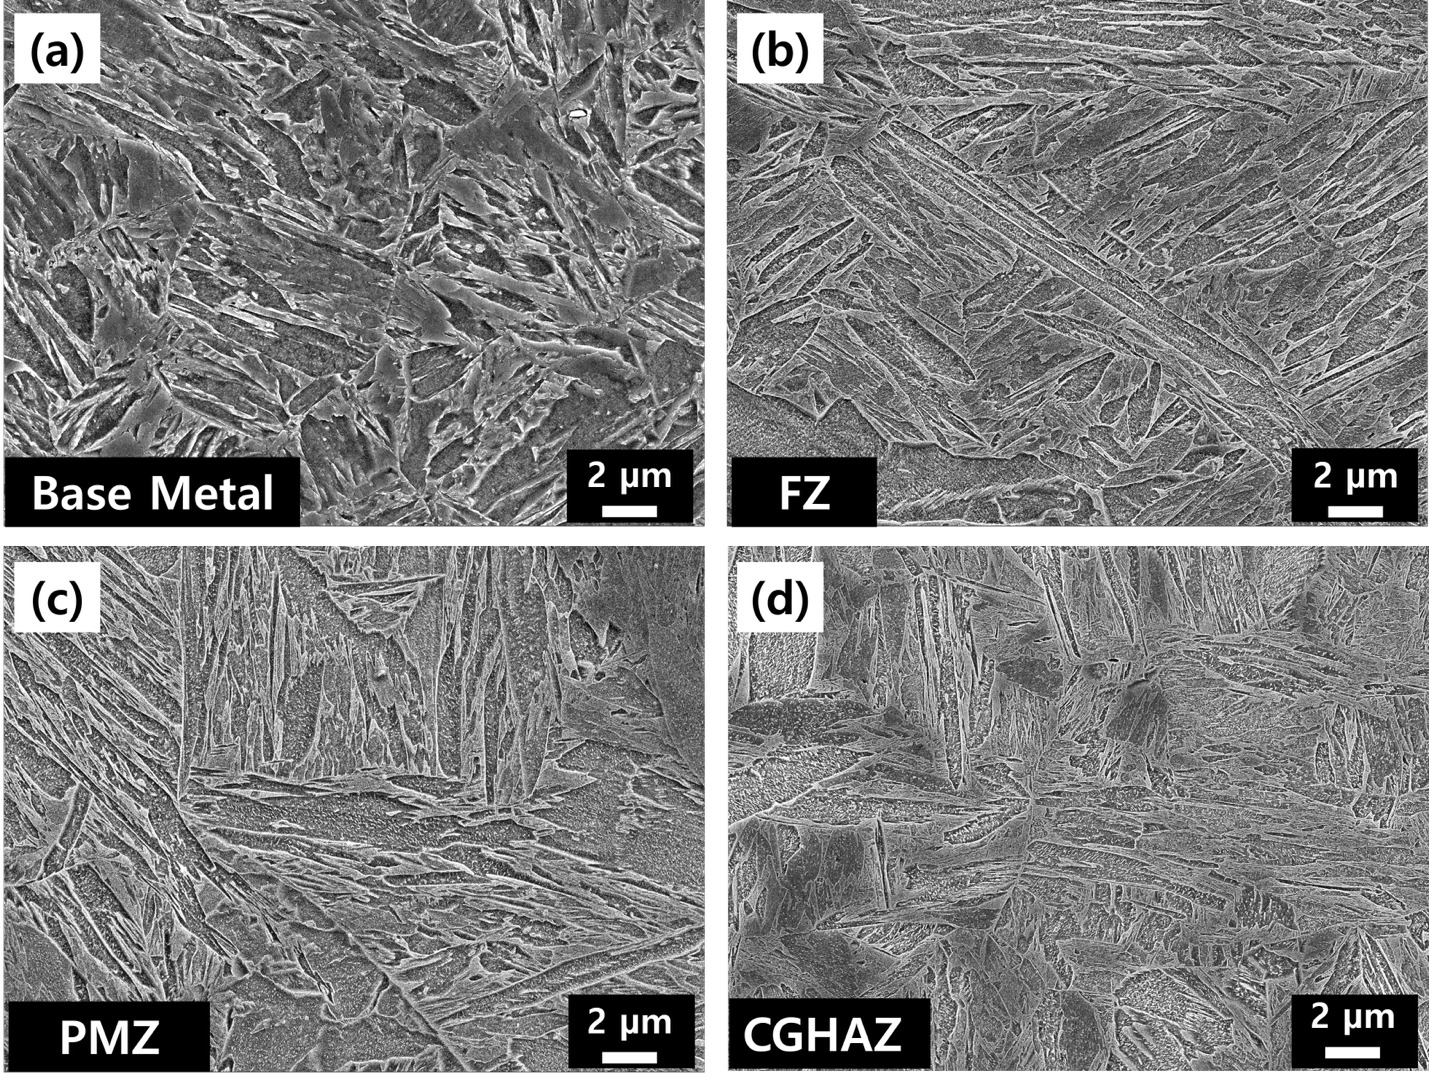
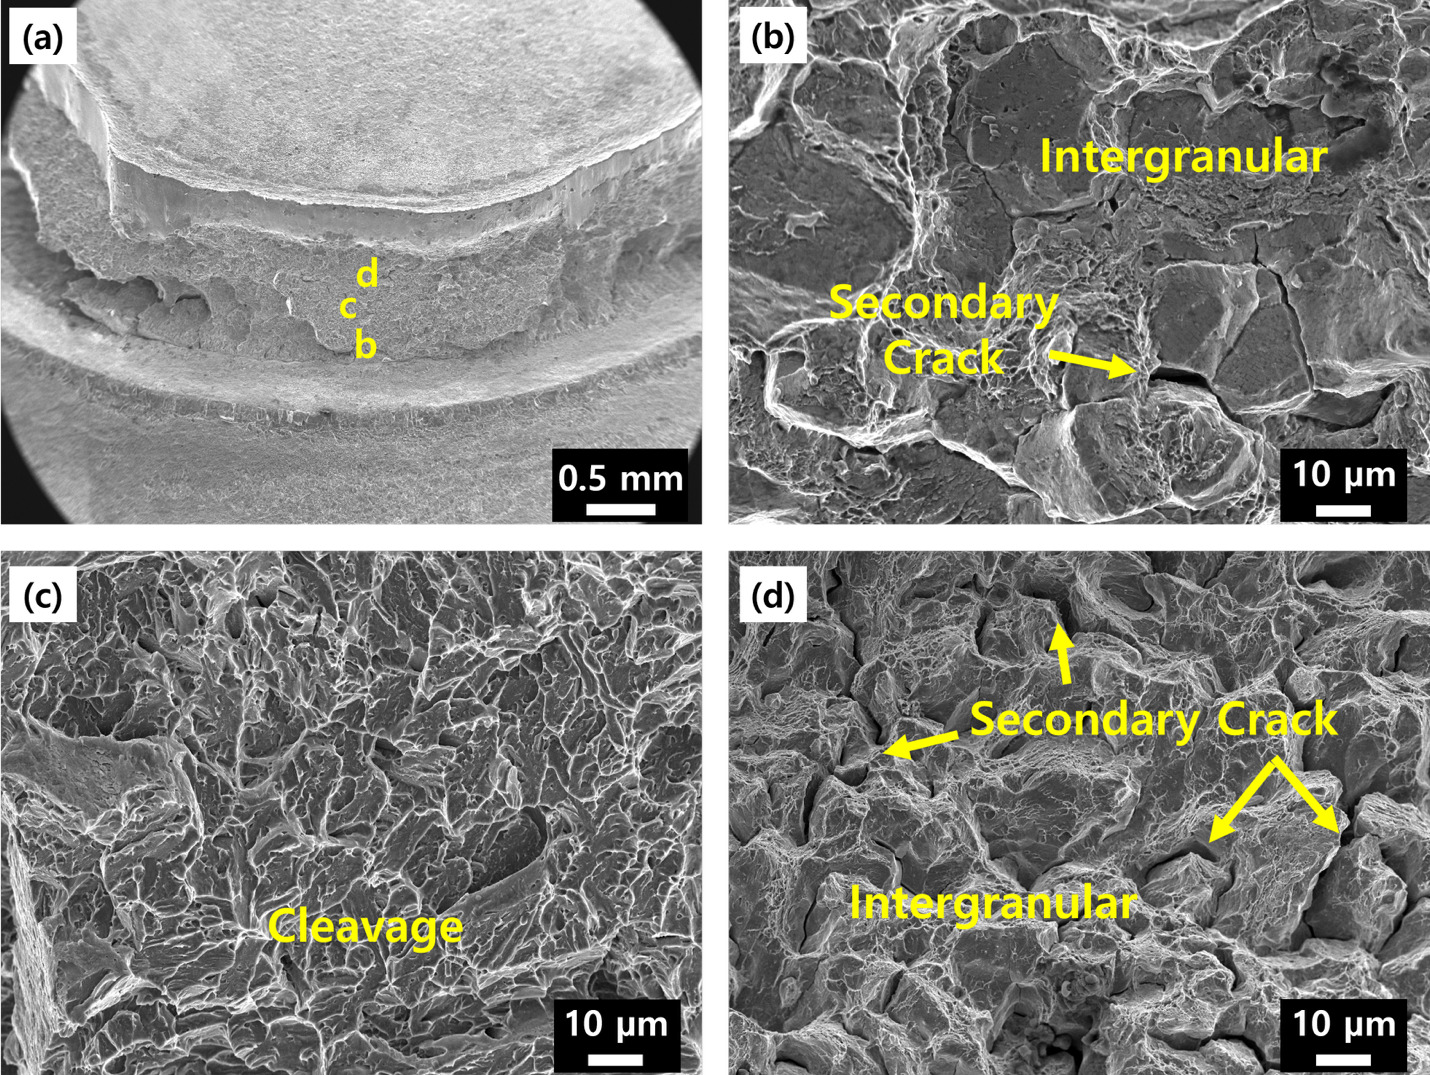
To identify the cause of crack propagation along the PMZ from a microstructural perspective, microstructures in the base metal (BM), FZ, PMZ, and coarse-grained heat-affected zone (CGHAZ) were compared using SEM analysis. Martensitic microstructures were observed in all four regions. Quantitative measurements showed that the average prior austenite grain sizes in the BM, PMZ, and CGHAZ were 11 μm, 30 μm, and 67 μm, respectively. At the same time, the FZ exhibited a columnar solidification structure (Fig. 3). In the present study, the region near the notch (sheet-to-sheet interface), where crack opening is expected to initiate, was regarded as the crack initiation region. In contrast, the region farther along the crack path was considered the crack propagation region. Fractographic observation showed that intergranular cracks and secondary cracks coexisted in the crack initiation region (Fig. 4B). In the crack propagation region, cleavage facets were observed, together with areas where intergranular cracks and secondary cracks were intermixed (Figs. 4C and D).
Interrupted Cross Tension Test Results
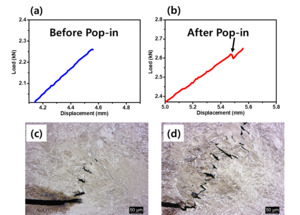
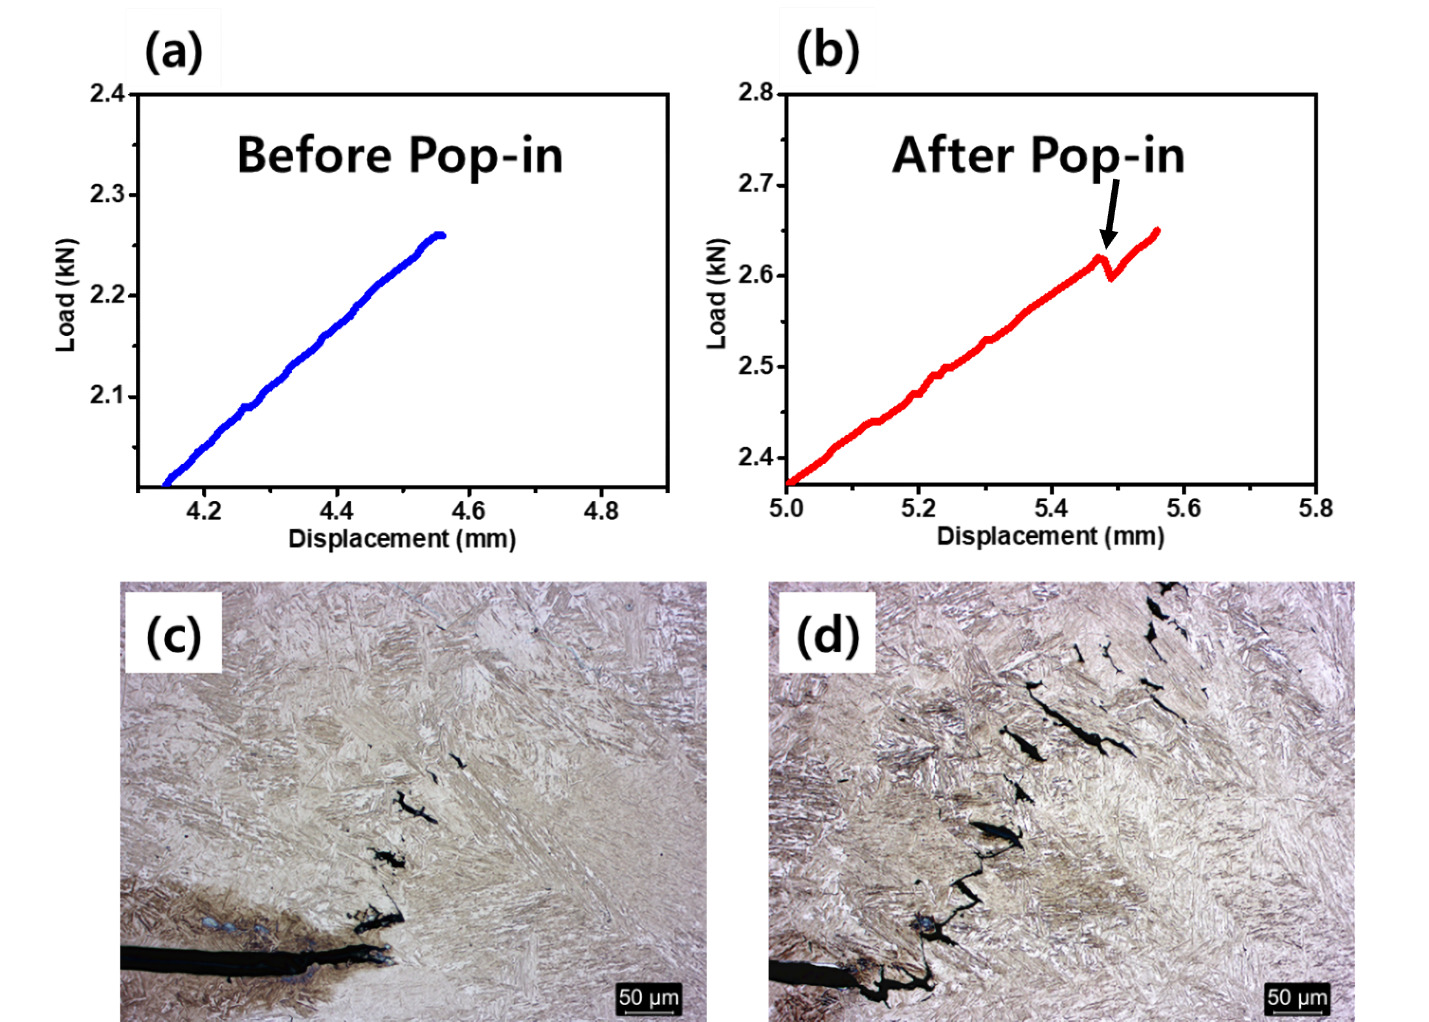
To directly examine crack propagation behavior, interrupted tests were repeated 4 times on samples prepared under identical welding conditions. The same qualitative two-stage crack propagation sequence, consisting of isolated pre-crack formation followed by crack linkage, was consistently observed in all four interrupted-test specimens. Observations were made before and after the pop-in event in the load–displacement curve (Figs. 5A and B). Krajcarz et al (Krajcarz et al. 2013). used pop-ins in the load–displacement curve to identify crack initiation-related events in the weld region of RSW specimens. In the present 1.8 GPa 30MnB5 weld, an interruption around the pop-in was used to identify the crack propagation sequence in the PMZ. Before pop-in, mutually isolated short cracks were observed within the PMZ (Fig. 5C). After pop-in, these isolated cracks were distributed more widely along the PMZ, and thin crack segments connecting adjacent cracks were additionally observed. Isolated cracks were also observed ahead of the crack tip (Fig. 5D). The observations before and after pop-in indicate that the present 1.8 GPa 30MnB5 weld exhibited a two-stage crack propagation process, involving the local formation of isolated cracks in the PMZ, followed by their linkage into a continuous crack path. Based on these observations, the isolated cracks that formed locally before being incorporated into a continuous crack path are referred to as pre-cracks, whereas the continuous crack formed by the coalescence of these pre-cracks during further loading is referred to as the main crack.
Temperature History Simulation and Pre-Crack Characterization
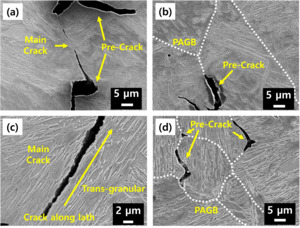
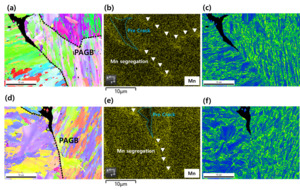
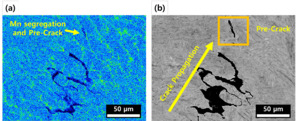
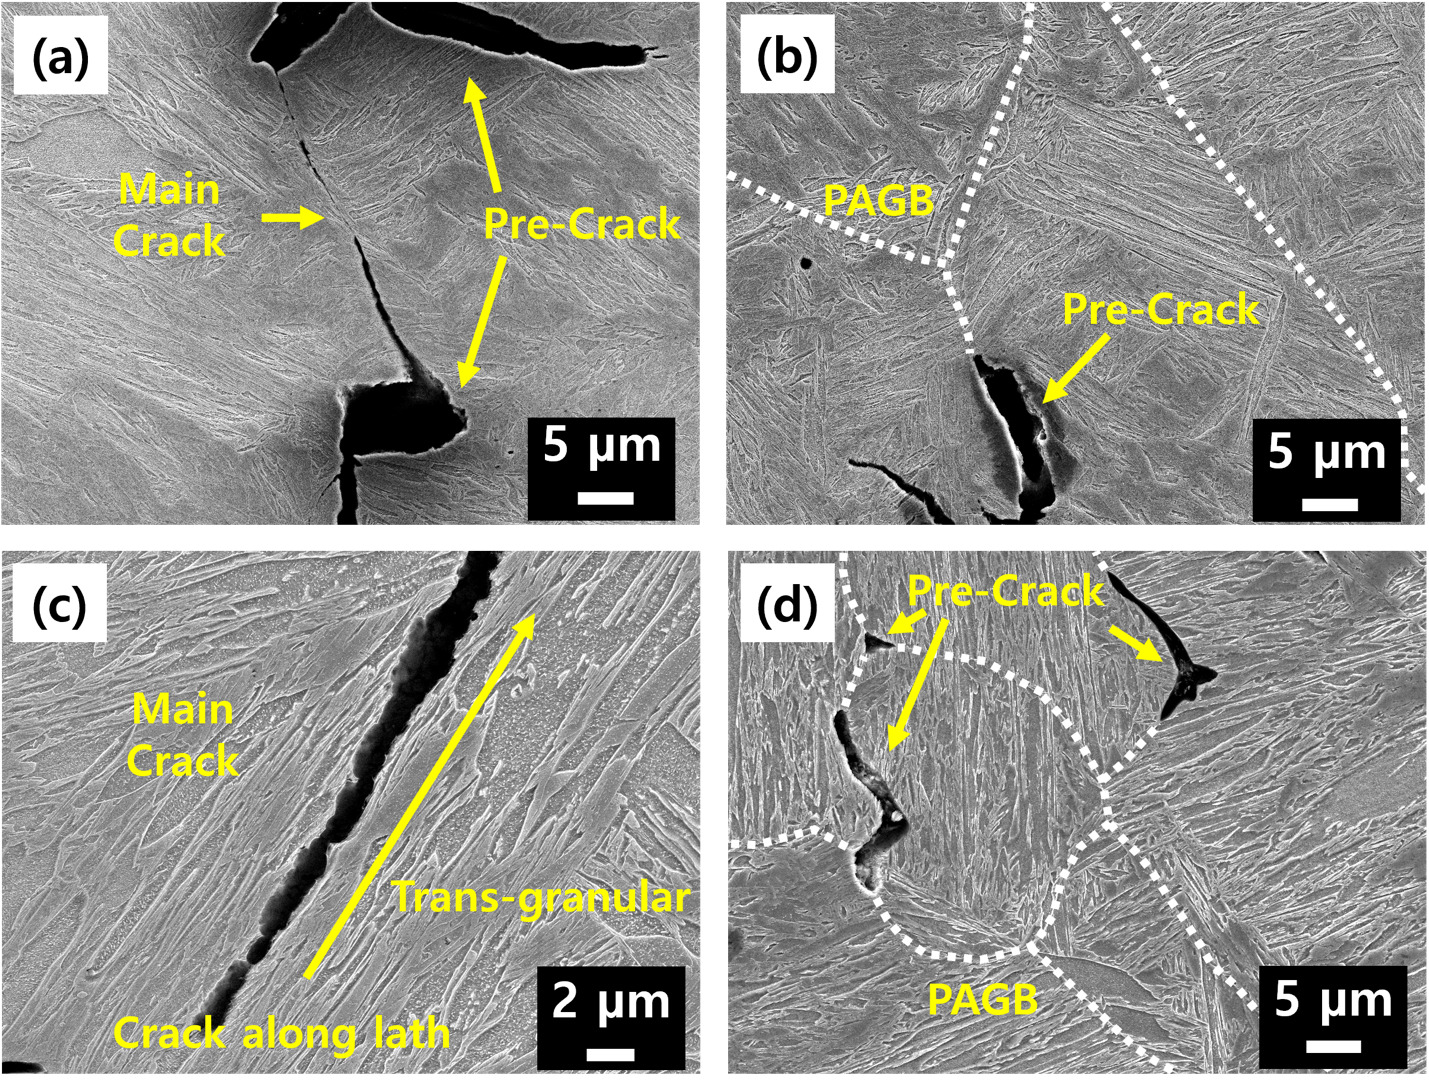
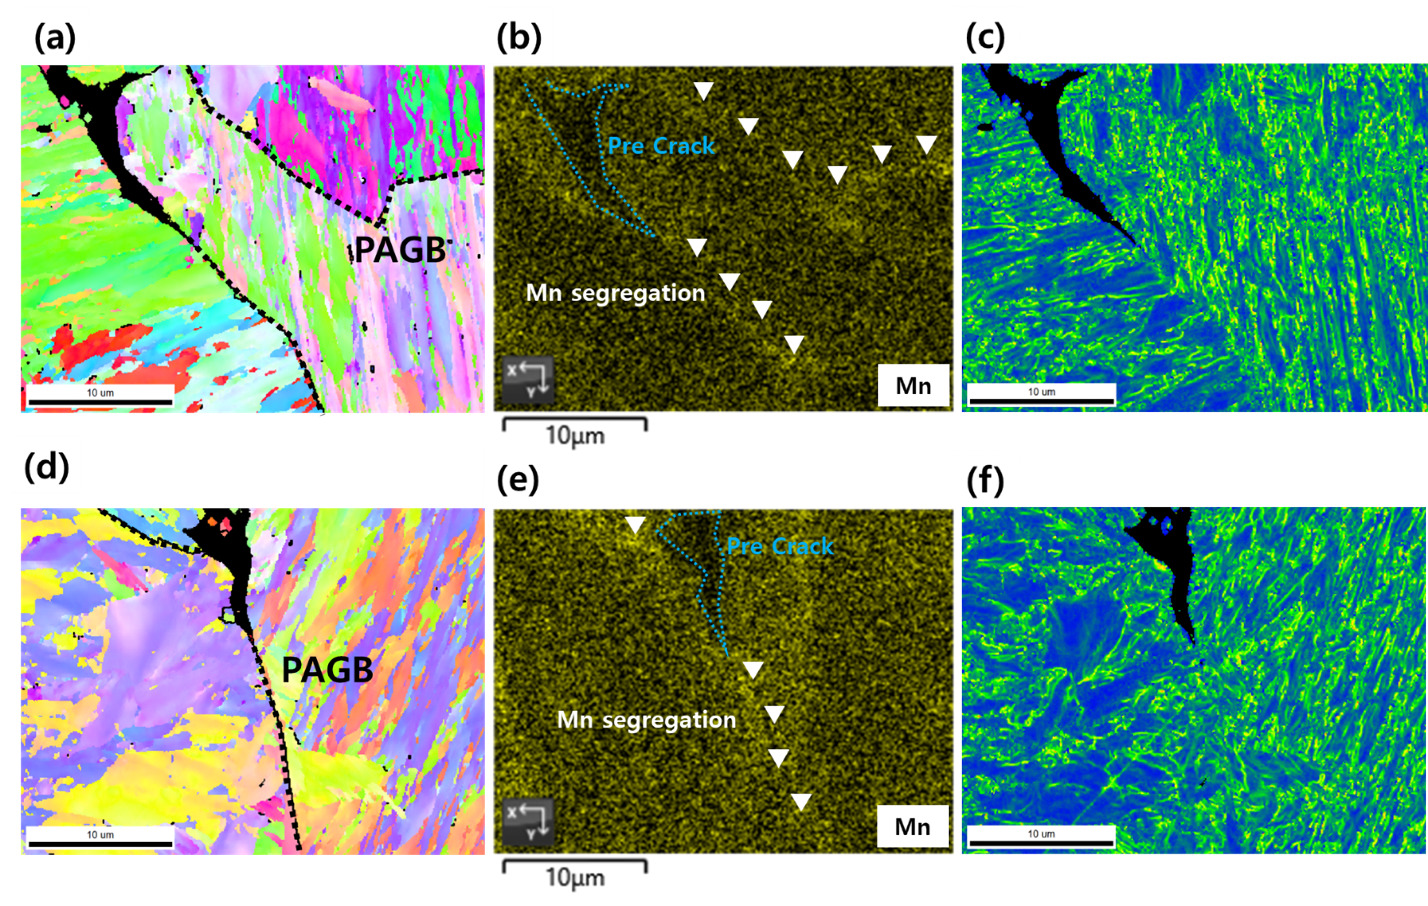
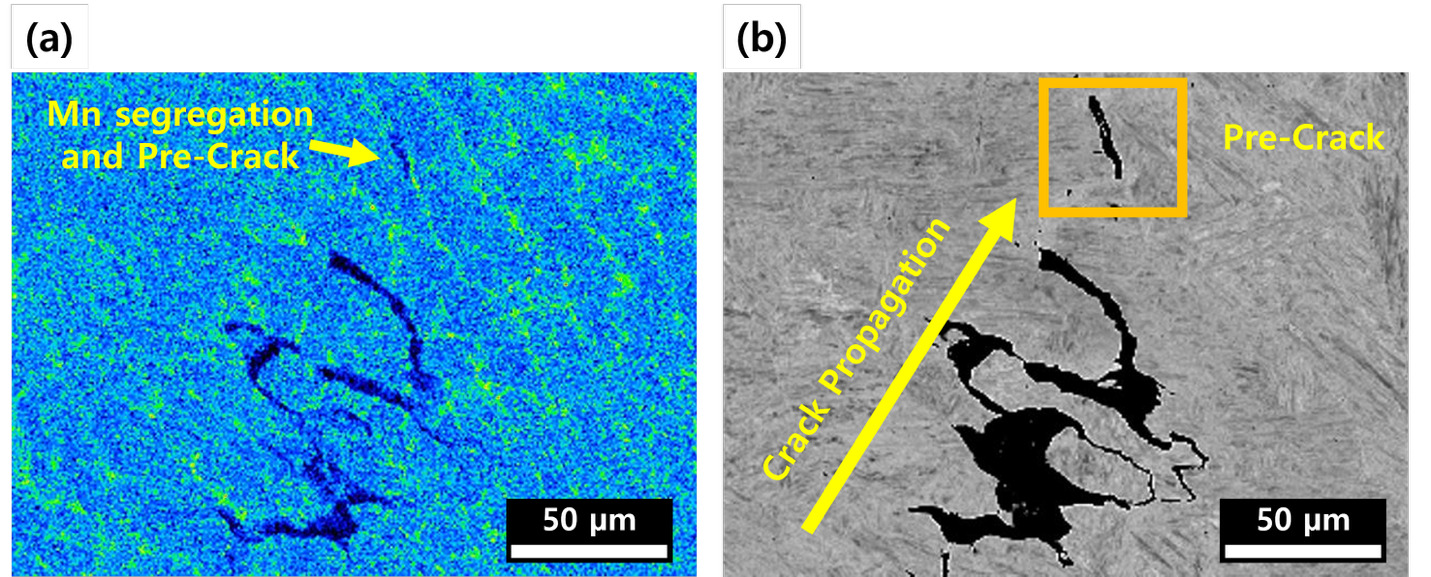
The temperature history simulation indicated that the PMZ remained in the δ-ferrite + liquid two-phase field for approximately 70 ms (Fig. 6D). This suggests that a transient liquid film may have formed along the fusion boundary during welding, thereby facilitating local solute redistribution in the PMZ. SEM observation of specimens interrupted after pop-in showed that the pre-cracks were mainly formed along the prior austenite grain boundaries (Fig. 7B). In contrast, the crack segments connecting adjacent pre-cracks propagated across the grain interiors in a transgranular manner, thereby forming the main crack path (Fig. 7C). Additional isolated pre-cracks were also identified at PAGBs ahead of the main crack (Fig. 7D). To examine whether the crack path was associated with elemental segregation, the regions containing pre-cracks were analyzed by EBSD and EDS. The EBSD results showed that the pre-cracks were located along the PAGBs (Figs. 8A and D), while the corresponding EDS maps showed Mn enrichment at the same locations (Figs. 8B and E). Comparison of the Mn distribution and pre-cracks by EPMA further showed that relatively high Mn signals were observed in regions where pre-cracks formed (Fig. 9). These results suggest that Mn segregation at PAGBs in the PMZ was closely associated with the preferential formation of pre-cracks and subsequent crack propagation along the PMZ.
_and_nanoscale_secondary_ion_mass_spectrometry_(nano-si.tiff)
Results of TEM Observations
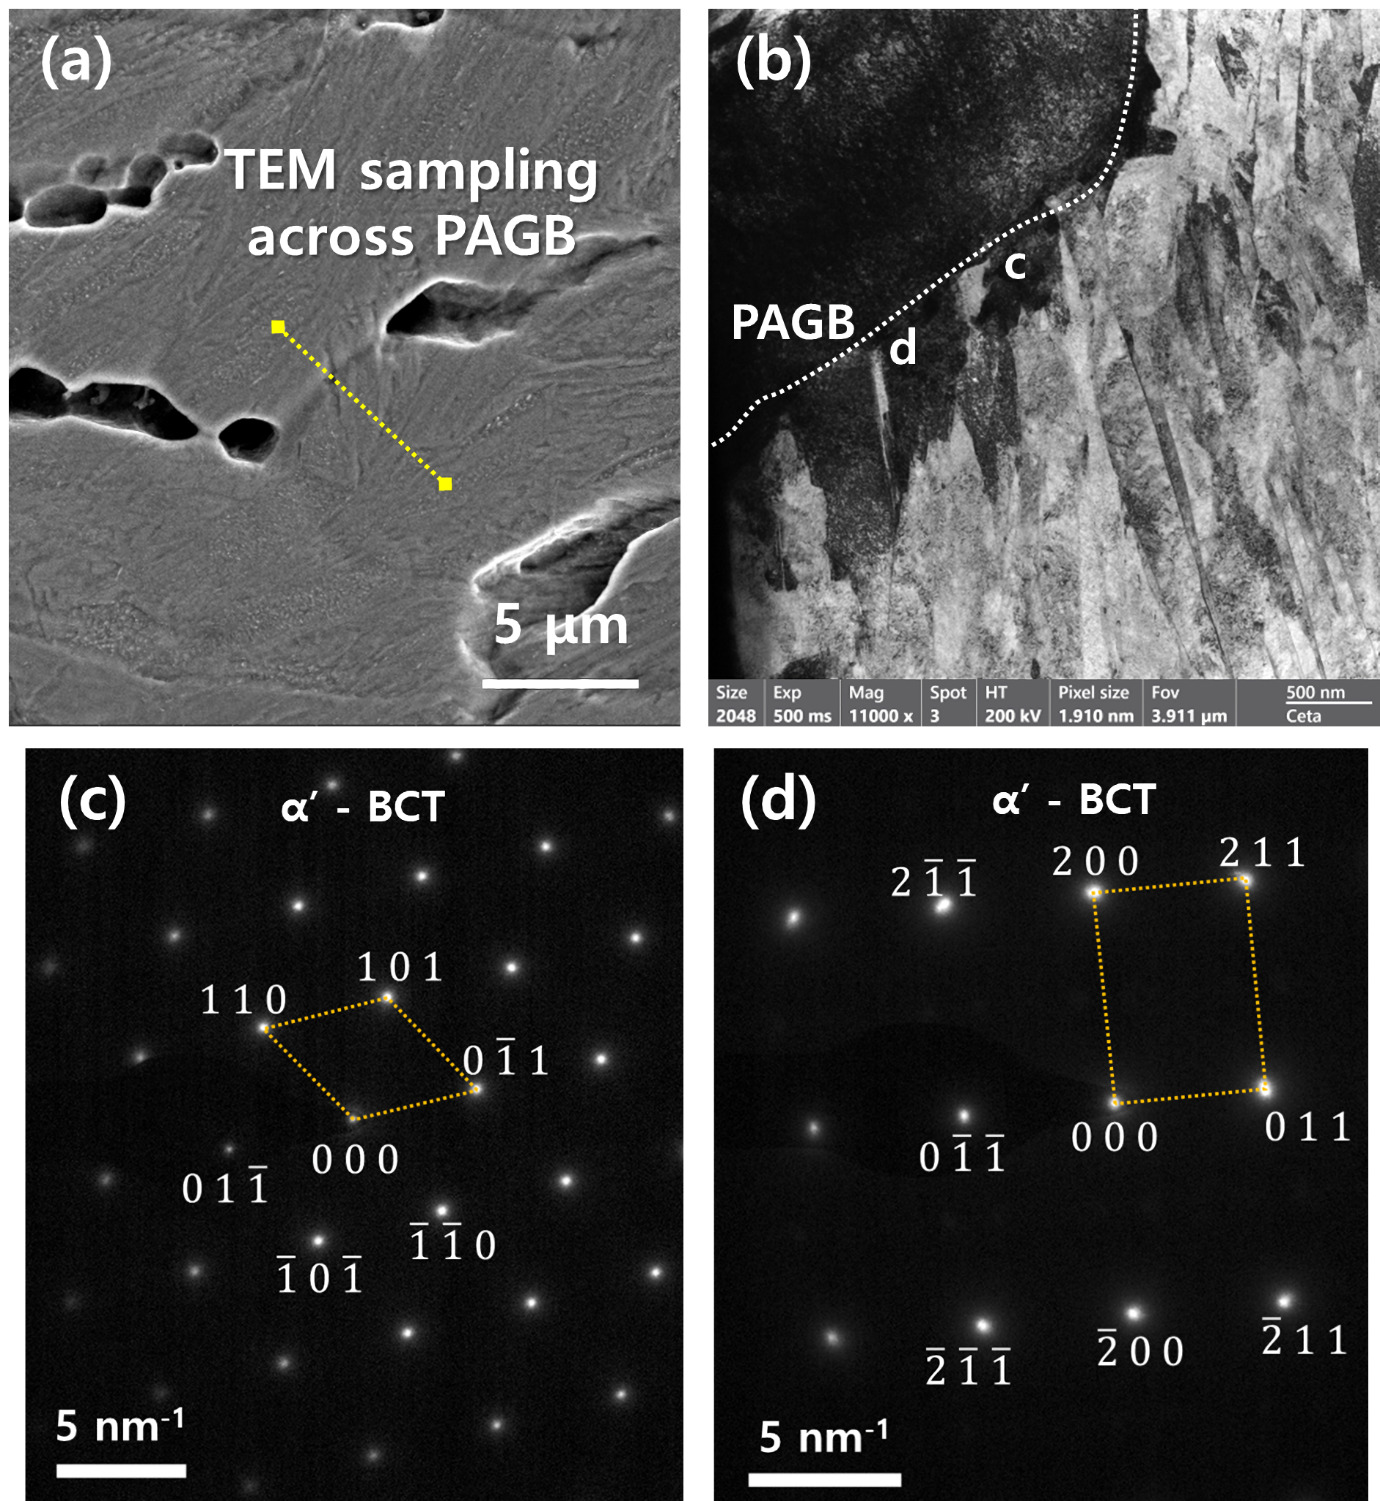
TEM analysis was performed to examine the nanoscale microstructure and local phase constitution of the PMZ near the PAGB, where pre-cracks were preferentially observed. As shown in Fig. 10A, the TEM specimen was prepared by FIB lift-out across the PAGB so that the PAGB was included in the sampled region. The corresponding TEM image in Fig. 10B shows a lath martensitic structure near the PAGB. The width of each visible martensite lath was measured from the TEM image, and the average lath width was determined to be approximately 262 nm. Selected area electron diffraction (SAED) analysis was conducted to identify the local crystal structure of the PAGB-neighboring region. The SAED patterns obtained from the regions marked near the PAGB in Fig. 10B were indexed as BCT α′-martensite, with a c/a ratio estimated from the reciprocal spot spacings to be approximately 1.015–1.017 (Figs. 10C and D). These results indicate that the examined region near the PAGB in the PMZ consisted mainly of BCT α′-martensite.
Discussion
Cross-sectional observation and hardness mapping of the joints showed that a PMZ formed adjacent to the fusion boundary (Fig. 1C), and local softening was confirmed in the same region (Fig. 1D). According to previous studies, such a softened region is known as the halo ring. It has been reported that the region near the fusion boundary undergoes softening due to carbon redistribution and decarburization during welding. Such softening allows cracks to propagate along the halo ring (Sherepenko et al. 2020, 2021; Mohamadizadeh et al. 2020; Jing et al. 2023; Ramachandran et al. 2022; Manladan et al. 2025; Ramachandran et al. 2023; Liu et al. 2019). In the present welds, the region where PMZ formed, and softening was observed spatially overlapped (Figs. 1C and D), suggesting that elemental segregation and softening may have acted together to influence the low cross-tension strength and the PMZ-region crack propagation behavior. This point is discussed in more detail in Elemental Segregation-Induced Crack Initiation and Propagation Behavior in the PMZ.
Two-Stage Crack Propagation Mechanism in the Partially Melted Zone
The cross-tension test results and crack path observations showed that the crack did not propagate into the FZ; instead, it initiated at the notch at the sheet-to-sheet interface and propagated along the PMZ (Fig. 2B). The peak load corresponds to the CTS of the weld, representing the critical load for final fracture. As the fractured cross-section showed crack propagation along the PMZ rather than through the FZ, the CTS was mainly governed by fracture along the PMZ (Fig. 2A). To analyze the cause of crack propagation along the PMZ from a microstructural viewpoint, SEM observations were used to compare the microstructures of each region, as discussed in SEM Observations of Weld Area Microstructures and Fracture Surfaces. These observations revealed that the BM, FZ, PMZ, and CGHAZ all consisted predominantly of martensite (Fig. 3). Thus, the preferential crack propagation through the PMZ appears to be associated with the formation of a locally embrittled region resulting from compositional heterogeneity caused by segregation during PMZ formation (Figs. 1D and 6A–C). In addition, the crack path observed in the cross-sections showed a somewhat non-linear morphology (Fig. 2B). Considering that elemental segregation readily occurs in the PMZ, this non-linear propagation may reflect selective crack growth along segregated regions. This was confirmed by the Mn segregation observed along the PAGBs. Therefore, it appeared that elemental segregation controlled the crack propagation behavior. To further examine the fracture characteristics associated with this crack propagation behavior, the fracture surfaces were examined using an SEM (Fig. 4).
Fractographic observations, as discussed in SEM Observations of Weld Area Microstructures and Fracture Surfaces, showed intergranular cracks and secondary cracks in the crack initiation region, whereas cleavage morphology was observed together with intergranular and secondary cracks in the crack propagation region (Fig. 4). This suggests that the crack initially started in a brittle manner along the PAGBs in the PMZ. In addition, considering the cleavage features observed in the propagation region, it is believed that cracking initiated at the grain boundary and then propagated through the grain interior (Fig. 4). Stress-driven cracks typically transition from grain-boundary cracking to transgranular propagation.
Interrupted tests were conducted to directly verify crack propagation behavior. According to Krajcarz et al (Krajcarz et al. 2013)., the occurrence of pop-in on the load-displacement curve coincides with crack initiation. In the present study as well, interrupted tests performed before and after pop-in (see Interrupted Cross-Tension Test Results) showed that independent pre-cracks formed in the PMZ before pop-in (Fig. 5C), whereas after pop-in, the distribution of pre-cracks expanded and several of the pre-cracks joined to form the main crack (Fig. 5D). New pre-cracks were also found ahead of the crack tip (Fig. 5D). Based on these observations, the crack propagation sequence can be described as follows:
-
Pre-cracks preferentially formed in the PMZ, indicating that the PMZ acted as a favorable location for crack initiation (Fig. 5C).
-
As pre-cracks became linked, the crack propagated preferentially along the PMZ (Figs. 5D and 7A).
-
Independent pre-cracks continue to form ahead of the main crack tip in the PMZ and were subsequently linked. This eventually led to a final fracture and low cross-tension strength (Figs. 5D and 7D).
The next issue to clarify from this study is the cause of pre-crack formation in the PMZ. Based on the crack propagation behavior observed in the interrupted tests, the intergranular and secondary cracks observed on the fracture surface can be regarded as pre-cracks, whereas the cleavage features observed in the crack propagation region can be interpreted as the main crack linking these pre-cracks (Figs. 4 and 7). Therefore, it is necessary to examine both pre-crack formation at PAGBs in the PMZ and elemental segregation.
Elemental Segregation Induced Crack Initiation and Propagation Behavior in the PMZ
EPMA mapping was conducted to compare the elemental distributions in PMZ, FZ, and CGHAZ. The results showed that the Mn concentration was higher in the PAGBs of PMZ than in the fusion zone (FZ) and the coarse-grained heat-affected zone (CGHAZ) (Fig. 6A). Another feature is that carbon depletion was observed in the PMZ (Fig. 6B). No phosphorus segregation was detected in the present study in any of the regions examined (Fig. 6C). To further examine the elemental distributions, Nano-SIMS analysis was performed for boron and phosphorus in the PMZ. The Nano-SIMS phosphorus map also showed no clear phosphorus enrichment in the PAGBs of PMZ (Fig. 6F), indicating that phosphorus segregation was not detected within the sensitivity and spatial range of the present analysis. In contrast, local boron enrichment was observed in the PAGBs of PMZ (Fig. 6E). From EPMA analysis, a continuous network-like manganese segregation was observed in the overall PMZ region compared with the FZ and CGHAZ (Fig. 6A). This is quite possible because, during welding, the temperature near the fusion boundary resides in the two-phase region where δ-ferrite and liquid coexist. Manganese, whose solid-liquid partition coefficient is less than 1, migrates into and becomes enriched in the liquid before solidification is complete (Jing et al. 2023, 2022). In addition, a higher carbon content in the steel is known to reduce the driving force required for the austenite to δ-ferrite + liquid transformation, making this phenomenon more likely to occur even during a short thermal cycle (Taniguchi et al. 2024) (Fig. 6D).
EPMA revealed decarburization in the PMZ (Fig. 6B), which is consistent with the softening observed in the PMZ (Fig. 1D). This carbon depletion is considered to result from carbon redistribution toward the liquid phase due to the difference in carbon solubility between the solid and liquid phase (Sherepenko et al. 2020).
Phosphorus is generally known to weaken grain boundary cohesion in steel and cause intergranular fracture when it segregates to grain boundaries; however, no phosphorus segregation was observed in the present study (Fig. 6C). Although Mn is not widely recognized as a major direct contributor of embrittlement, studies on medium-Mn steels have reported that strong Mn segregation can reduce grain boundary cohesion and induce intergranular fracture (Heo et al. 2013; Ito et al. 2019; Kuzmina et al. 2015). In addition, the temperature history simulation (see Temperature History Simulation and Pre-Crack Characterization) showed that the PMZ remained in the δ-ferrite + liquid region for a short period (Fig. 6D), supporting the conclusion that Mn became concentrated in the liquid during this stage, resulting in final Mn segregation.
Examination of pre-cracks formed in the interrupted-test specimens using SEM, EBSD, and EPMA (see Temperature History Simulation and Pre-Crack Characterization) showed that many pre-cracks were found along the PAGBs (Figs. 7B and 8), and the pre-crack tips were located along extensions of the PAGBs (Figs. 7B and D). This suggests that pre-cracks are preferentially formed along PAGBs, supporting PAGBs as preferential sites for pre-crack formation in the PMZ.
Finally, to determine whether Mn segregation existed at the pre-cracks formed along PAGBs, regions adjacent to pre-cracks were examined by EBSD and EPMA (see Temperature History Simulation and Pre-Crack Characterization). Pre-cracks were present along PAGBs, and Mn-rich signals were detected at the same locations (Figs. 8 and 9A). Kernel average misorientation (KAM), which represents the average misorientation between a measurement point and its neighboring points, was used to evaluate local lattice distortion and strain accumulation near the pre-cracks. The KAM values in the pre-crack regions were similar to those of the surrounding areas (Figs. 8C and F), indicating that no significant local strain accumulation was detected near the pre-cracks. In contrast, Mn-rich signals were detected at the same locations as the pre-cracks (Figs. 8 and 9A). These results suggest that Mn segregation at PAGBs was associated with the formation of pre-cracks in the PMZ. Although carbon depletion may contribute to the softening of the PMZ, it does not fully explain the preferential formation of pre-cracks at specific PAGBs. In contrast, the spatial correspondence between Mn enrichment and the pre-cracks suggests that localized Mn segregation is more directly associated with the preferential crack-initiation sites.
EPMA mapping further showed that Mn segregation was preferentially distributed within the PMZ, particularly along the PAGBs between adjacent PMZ grains and near the fusion boundary, whereas Mn enrichment became less pronounced toward the CGHAZ. As the isolated pre-cracks preferentially formed along the Mn-enriched PAGBs, their orientation along the PMZ appears to be associated with the distribution of Mn-segregated PAGBs within the elongated PMZ grains.
Nano-SIMS analysis further showed that phosphorus enrichment was not detected in the examined PMZ region (Fig. 6F), which was consistent with the EPMA result (Fig. 6C). Therefore, phosphorus segregation is unlikely to be the primary factor responsible for the intergranular pre-crack formation observed in the present welds. In contrast, local boron enrichment was observed along PAGBs of PMZ (Fig. 6E). The role of boron segregation, however, should be interpreted carefully. One previous study reported that boron segregation at grain boundaries can enhance cohesion and suppress intergranular brittle fracture (Park et al. 2026). The precise determination of grain-boundary boron content is beyond the scope of this investigation. While a small amount of boron (typically 10 to 30 ppm) is highly beneficial for increasing steel hardenability and grain-boundary cohesive strength, exceeding this optimal threshold forces boron to the PAGBs, and this segregation has some negative effects. Because boron significantly lowers the local melting point of the iron matrix, this grain boundary segregation can trigger premature melting along the boundaries well below the steel’s liquidus temperature. However, extensive fractographic observations of several samples in this study did not show any evidence of either molten metal or liquefied grain facets, which are characteristic features of localized melting at grains or grain-boundary liquation, respectively. Thus, the role of boron as the causative factor of pre-crack formation did not appear to be the case. It is believed that boron enrichment at PAGBs does not account for the preferential formation of pre-cracks in the PMZ. In the present study, pre-cracks were spatially associated with Mn-rich PAGBs, and Mn enrichment was confirmed at the same locations by EBSD-EDS and EPMA. Thus, it appears that the preferential formation of pre-cracks is directly associated with Mn segregation at PAGBs.
TEM analysis was further used to examine whether any additional localized embrittling microstructural feature existed near the Mn-segregated PAGB. Previous studies have shown that localized microstructural features can act as crack-initiation-related factors in brittle fracture of Fe-based alloys (Mun et al. 2002; Mohseni et al. 2012; Li et al. 2015). Therefore, in the present study, a single site-specific TEM specimen was prepared by FIB lift-out across one PAGB so that the boundary region was included in the analyzed area (Fig. 10A). The TEM image showed a lath martensitic structure near the PAGB, with an average lath width of approximately 262 nm (Fig. 10B). The SAED patterns obtained from the regions near the PAGB were consistent with a martensitic matrix exhibiting slight tetragonality, with an estimated c/a ratio of approximately 1.015–1.017 (Figs. 10C and D). No additional distinct microstructural feature potentially associated with local embrittlement was identified within the examined TEM region. Although the TEM analysis was limited to a single site-specific specimen containing one PAGB, broader-area EPMA mapping covered multiple grains in the PMZ. Boron segregation was detected at the PAGBs (Fig. 6E). However, its role as the embrittlement-causing element is ruled out due to the lack of fractographic evidence of localized melting. The EPMA results showed Mn segregation in the PMZ (Fig. 6), and the EBSD and EDS results showed the spatial association between Mn segregation and pre-cracks (Fig. 8). Further, the EPMA results confirmed Mn enrichment at the pre-crack regions (Fig. 9). Thus, the EPMA and EBSD/EDS observations support the interpretation that pre-crack formation in the PMZ was more directly associated with Mn segregation at PAGBs rather than with the presence of the lath martensitic microstructure itself.
Main Crack Propagation Path within PMZ Grains
The interrupted test results showed that isolated pre-cracks first formed along PAGBs in the PMZ and subsequently linked to form the main crack. Although the pre-cracks were mainly associated with PAGBs, the main crack did not propagate continuously along them. Instead, it propagated across the grain interiors in a transgranular manner. This indicates that the crack propagation process in the PMZ consisted of two distinct features: the formation of pre-cracks along PAGBs and the subsequent linkage of these pre-cracks by the main crack, which propagated transgranularly.
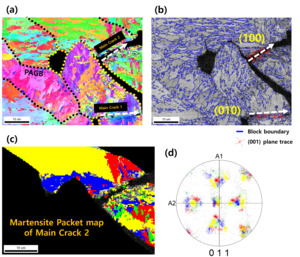
Because martensite packet and block boundaries have been reported to influence cleavage crack propagation in lath martensitic structure in steels (Morris et al. 2013; Bertolo et al. 2022; Shibata et al. 2023), EBSD-based martensite packet, block analyses were performed (Fig. 11). Regions with orientation deviations within 5° from the ideal Kurdjumov-Sachs relationship were grouped to construct martensite packet map (Taniguchi et al. 2024). Because the martensite variant grouping required for packet mapping was not clearly resolved in the 011 pole figure of the main crack 1 region, detailed packet analysis was performed in the main crack 2 region, where the variant grouping was more distinct (Figs. 11C and D). The martensite packet map showed that the main crack crossed martensite packets rather than propagate along packet boundaries (Fig. 11C). Similarly, no clear crack deflection associated with martensite block boundaries was observed, and the main crack was found to cross the martensite block (Fig. 11B). These results indicate that the transgranular propagation path of the main crack was not primarily controlled by martensite packet or block structures.
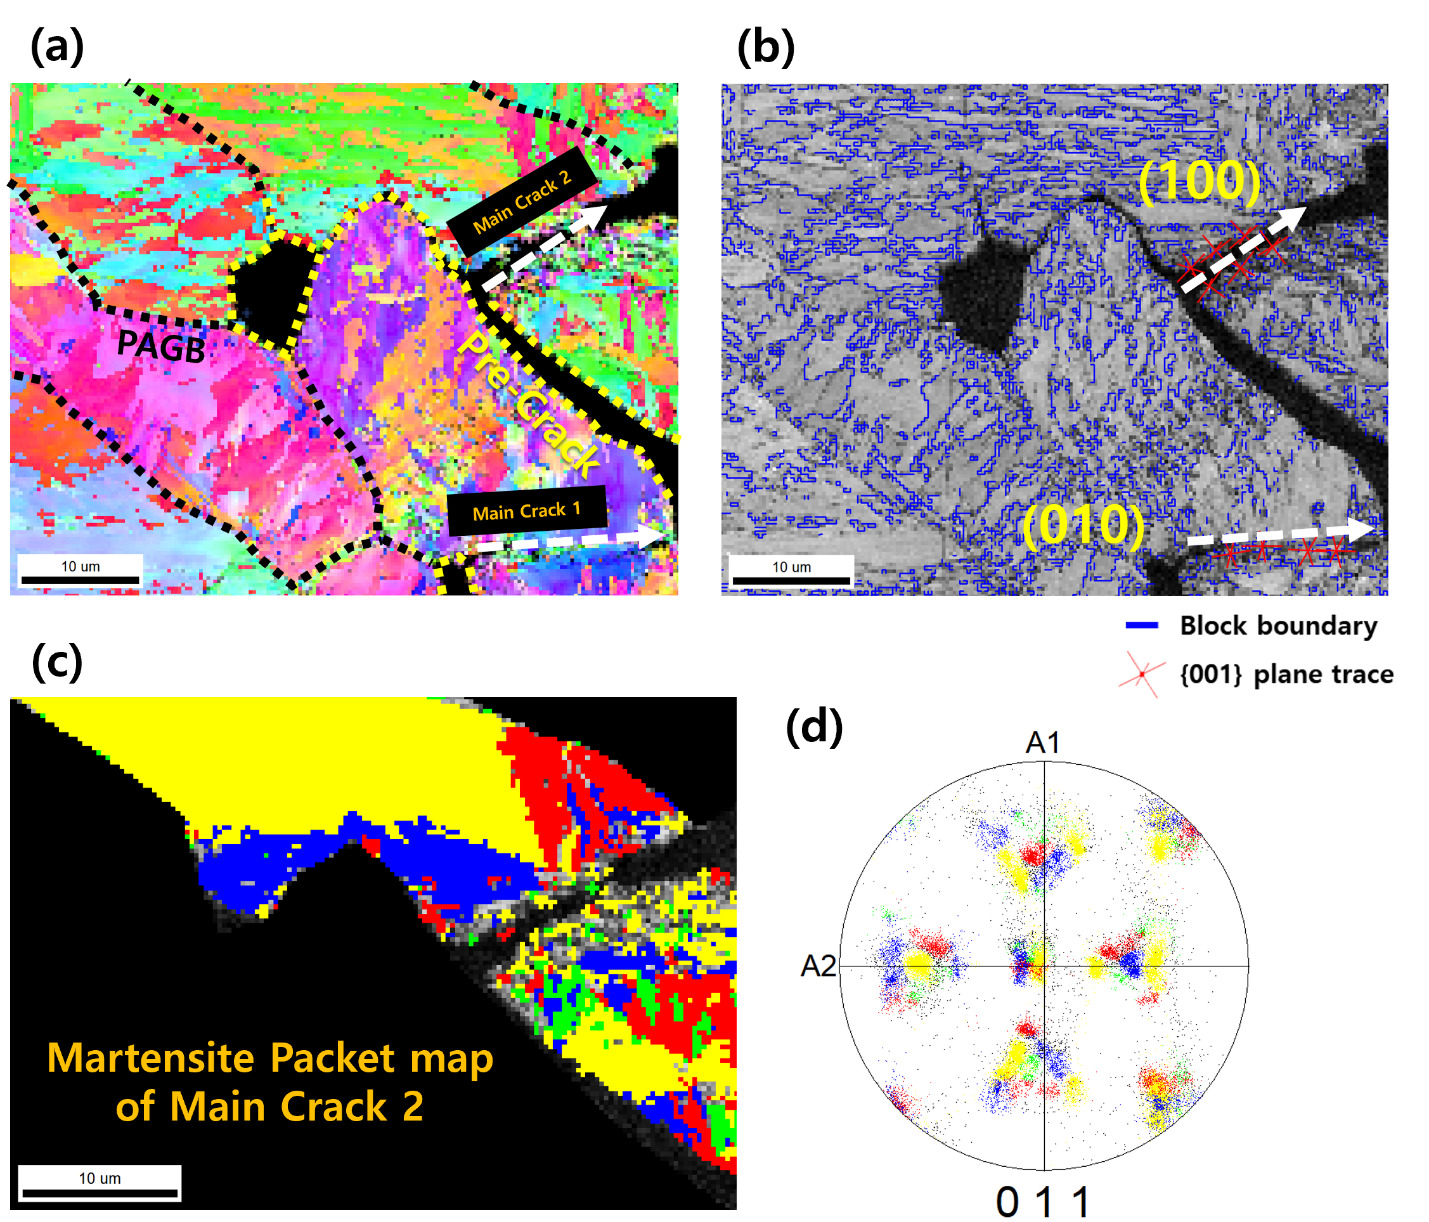
To further examine the crystallographic nature of the transgranular main crack, {001} plane trace analysis was conducted along the crack path. The trace analysis showed that the main crack segments were aligned with the traces of the (Mohamadizadeh et al. 2020) and (100) planes, which belong to the {001} plane family (Fig. 11B). This suggests that the transgranular segments of the main crack propagated along cleavage-related {001} planes in the martensitic matrix, which is consistent with previous reports that cleavage fracture in lath martensitic steels is associated with crystallographic crack propagation along {001} planes (Morris et al. 2013; Bertolo et al. 2022).
Based on these observations, the transition from PAGB-associated pre-crack to transgranular main-crack propagation can be interpreted as follows. The pre-cracks formed along PAGBs were local and discontinuous. During further loading, the main crack linked these pre-cracks and propagated through the grain interiors. As the main crack crossed packet and block boundaries and followed {001} plane traces, its transgranular propagation appears to be governed mainly by stress-driven cleavage-like cracking in the martensitic matrix, rather than by martensite packet or block boundary-controlled crack deflection. Therefore, the low cross-tension strength of the weld is attributed not only to the preferential formation of pre-cracks at PAGBs in the PMZ, but also to their rapid linkage through stress-driven propagation of the main crack.
Conclusions
This study elucidated the fracture characteristics and the two-stage crack propagation mechanism associated with Mn segregation in the Partially Melted Zone through cross-tension and interrupted-test resistance spot-welding of 1.8 GPa grade 30MnB5 hot-stamped boron steel. The main findings are as follows:
-
A partially melted zone formation was observed near the fusion boundary of the 30MnB5 resistance spot welds. The temperature history simulation showed that this region remained in the δ-ferrite + liquid two-phase field for approximately 70 ms during welding, thereby providing conditions for local solute redistribution. EPMA analysis confirmed Mn segregation in the PMZ, while carbon depletion in the PMZ was consistent with the lower hardness of this region compared with the fusion zone.
-
Interrupted tests revealed a two-stage crack propagation mechanism in the PMZ. Isolated pre-cracks first formed preferentially along Mn-segregated PAGBs. With further loading, these pre-cracks were linked to form the main crack, resulting in crack propagation along the PMZ and later across grains.
-
TEM analysis of the PAGB region did not identify any additional distinct microstructural feature that could independently explain the preferential formation of pre-cracks. Broader-area EPMA mapping covered multiple grains in the PMZ, and boron enrichment was detected at the PAGBs. However, no fractographic evidence was found to suggest either localized melting or grain boundary liquation. Boron is not considered to be the causative factor for pre-crack initiation. Together with the spatial correspondence between Mn segregation and pre-crack formation, these results support the interpretation that Mn segregation at PAGBs was more directly associated with the observed embrittlement than the presence of the lath martensitic microstructure itself.
-
The main crack propagated through grain interiors in a transgranular manner after linking the PAGB-associated pre-cracks. EBSD-based analysis showed that the main crack crossed the martensite packet and block structures rather than propagating along the boundaries of martensite packets or blocks. In addition, {001} plane trace analysis showed that the transgranular crack segments were aligned with cleavage-related {001} planes, consistent with stress-driven cleavage-like propagation in the martensitic matrix.
Acknowledgements
This research was supported by the Technology Innovation Program (Alchemist Project, 20012196, AI-based supercritical materials discovery) funded by the Ministry of Trade, Industry & Energy, Korea.